You Can Access All of a Company's Data with a Click of a Mouse
The Research Wizard makes it quick and easy to access all of a Company's stock data with a click of a mouse.
Any data, within the Research Wizard's universe of stocks, is only a click away.
Below are some quick tips on some of my favorite (and lesser known) ways to put all of this data at your fingertips.
Quick Tip #1: Accessing Company Data
This is probably my favorite way to quickly see any piece of data I want for any stock almost instantly without having to run a screen.
-
From the Menu Bar, click on Report and then Company Data.

-
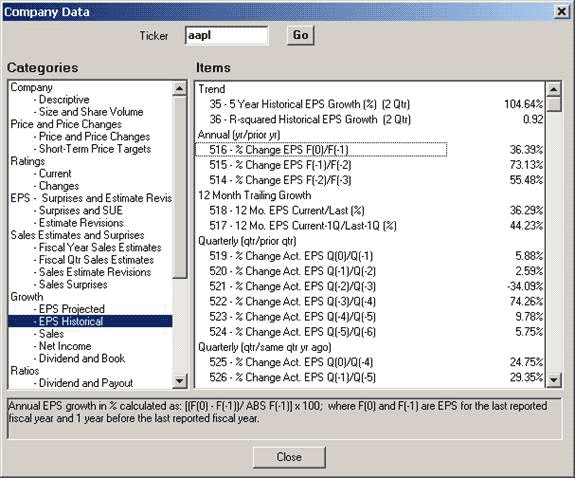
The Company Data window will then pop up.

You'll notice that all of the Categories and all of the Items that are available from the main page are available in this window too.
-
In the Ticker box, type in a Company's ticker symbol and then click Go. (Let's use AAPL for this example.)

Now, you'll be able to see all of the data values for all of the items for this stock with a simple click of the mouse.

In the above image, all of the data for all of the items associated with the selected category (e.g., Descriptive) is displayed.
Select a different Category, and all of the values for those items will be displayed.
You'll also notice that whichever item you click on in the Items window, the item's definition is displayed in the definition box at the bottom of the window as shown above. (And you can always tell which item you've selected because you'll see that a small 'marquee' surrounds the item. See the marquee surrounding Item #3, Company data?)
Note: the numbers preceding each item is simply the item's numerical identifier and is not an item's value.
For example:

'3' is the numerical identifier
These identifiers are how the database identifies an item and how an item in represented in a Calculated Expression.
The next time you need to quickly access a certain data point (or points) for a stock, try using the Company Data window.

Quick Tip #2: Viewing Data Summary and Distribution Statistics
Here's another great data feature that's not well known but extremely helpful.
There will be times when you're not sure what values are considered good or bad for an item. Or you may simply want to have a visual view of how the data values are distributed across all the stocks in the universe.
Now you can.
-
From the main page, select a Category and an Item as you normally would when building a screen or report.
For this example, let's use P/E using 12 months EPS

-
Once the item is selected, right-click it once with your right mouse button. A menu will pop up. Select Item Summary (as shown below.)

-
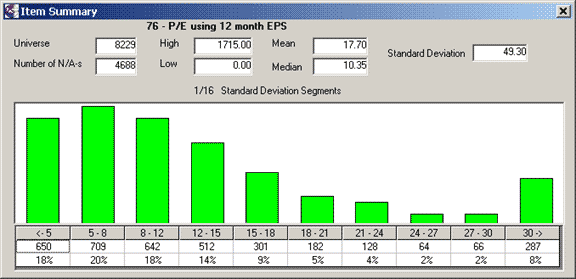
After left-clicking Item Summary, an Item Summary Window will pop up.

Now you can see how an item's values are distributed across all the stocks in the universe.
This window contains the following statistics:
Universe - number of stocks in the universe
Number of N/A-s – number of N/A's for this item in the universe
High – the highest value for the item in the universe
Low – the lowest value for the item in the universe
Mean – the average value for the item in the universe
Median – the median value for the item in the universe
Standard Deviation – the standard deviation for the item in the universe
-
There's also a graphical Item Summary Histogram Table
This display groups the values into equal ranges around the item's mean value.
Each bar represents the number of companies within a certain range of values to visually show how the items data values are distributed amongst all the companies in the universe.
The Item Summary Histogram Table has three rows. The first row contains the segments of the values range. The second row contains the number of companies falling within the particular range. The third row shows the percentage of companies within the particular range.
The next time you're building a screen and are wondering what value to use, take a look at the Item Summary window to see how that item is distributed over all the other stocks in the universe to get a point of reference.
Quick Tip #3: Accessing the Zacks Company Snapshot Reports and More
This article wouldnt be complete without mentioning how to access the Zacks Company Snapshot reports which feature key decision making information.
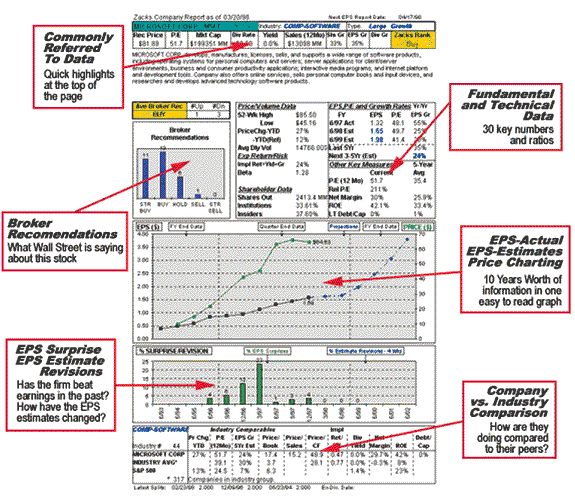
This color report includes a company description, actual and estimated EPS, company vs. industry ratings, fundamental data, broker recommendations, price charts and the Zacks Rank.
Zacks Company Snapshot
To access the Zacks Company Snapshot from the main page:
-
Click on the Snapshot button on the left side of the program.

-
Once the Company Reports window pops up (below) type in a ticker symbol in the Enter Ticker box.
(As a default, you'll see the Zacks Company Snapshot radio button will be selected.)

Click the OK button and the Zacks Company Snapshot report will pop up. (See below.)

From this report you'll find the:
Some of the most Commonly Referred to Data in the Company Summary Table at the top of the report.
Access other Key Measures in the Fundamental and Technical Data window.
See what Wall Street is saying about the stocks in the Broker Recommendations section.
At the center of the report is the EPS-Actual, EPS-Estimates chart. This chart plots the stock price versus the 12-month earnings per share. The chart includes fiscal year-end data going back five years, quarter-end data for the last four quarters and estimates for the next two quarters. It also shows the estimated earnings that are projected one, two, and three-five years out. The overlay of both price and earnings provides a visual representation of how the stock has been trading relative to its past growth in earnings as well as how analysts perceive its future earnings growth prospects.
Beneath that chart is the EPS Surprise and Estimates Revisions graph.
And at the bottom of the Snapshot there's a Company vs. Industry Comparison table where you can instantly size up a company compared to its peers.
View these reports through the program or print them for reading.
As a convenience, you can also print up multiple Snapshot reports with a single click of your mouse.
Just run a screen or open up a portfolio.
For a screen:
run a screen as you normally would
then hit your back button to get back to the main page
click on the Snapshot button
-
click the Print Snapshot for Active Tickers button (see below)

Note: once you click on this button, a window will pop up asking you if you want to print out all of the 'X' number of Company Snapshot Reports. (See below.) If you do, click Yes and they will begin printing. If you don't, click No to cancel.

In the above screenshot, there are 25 active tickers with Company
Snapshot Reports to print up.
Running Expanded Company Reports
-
Click the Snapshot button

-
When the Company Report window pops up, type in a ticker and then select the Expanded Company Reports radio button.

From the drop down box, you'll be able to choose from many different reports.

Click on any one of the reports and then click OK and they will open up in a new browser window.
The different Expanded Company Reports are:
Company Profile
Full Company Report
Research Summary
Earnings Estimates
Analyst's Recommendations
Industry/Sector
Insiders Report
Annual Income Statement
Annual Balance sheet
Annual Cash Flow Statement
Quarterly Income Statement
Quarterly Balance Sheet
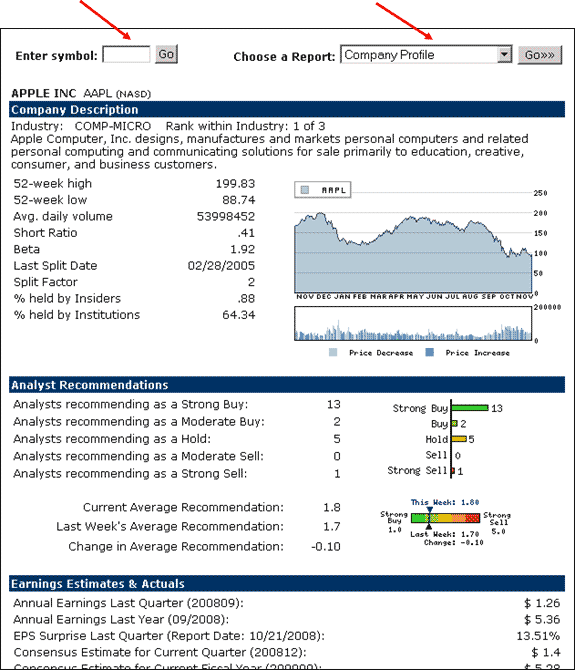
Below is a sample of one of the Expanded Company Reports. This one depicts a screenshot of the Company Profile report.
Once you're on this page, you can access any of the other reports from the Choose a Report drop down menu.
You can also look at reports for different stocks by typing in a new ticker in the Enter Symbol ticker box.

Interactive Charts and Zacks Equity Research
You can also access the Interactive Charts and Zacks Equity Research reports from the Company Reports window as well.
-
Click the Snapshot button

-
When the Company Report window pops up, type in a ticker and then select the Interactive Charts and Zacks Equity Research radio button.

-
Click the OK button and the Interactive Charts and Zacks Equity Research window pops up. (See below.)

In addition to the Interactive Java Charts, there are four fundamental overlay studies that can be applied as well:
- Price & Consensus
- 12 Month EPS
- Price & EPS Surprise
- Broker Recommendations
To apply them to a chart, just click on the corresponding radio button at the top of the window.

You can also access our Zacks Equity Research (ZER) reports from our team of senior analysts. Just click on the radio button next to ZER.
Zacks Equity Research provides the best of quantitative and qualitative analysis to help investors know what stocks to buy and which to sell for the long-term.
Our staff of senior analysts issue recommendations and target prices based on a six-month time horizon. The Zacks Equity Research analyst reports contain our analysts' recommendations as well as their in-depth written description on the company.
Note: You can also pull up the Interactive Charts and Zacks Equity Research window from the report page.
Just run a screen or report as you normally would.
-
On the report page, just:
- left click the ticker to select it
- then right click it
- and then choose Interactive Java Charts and ZER

When the Chart window is activated in this manner, all of the report's tickers are listed on the right.
-
To scroll through the list, click the Up and Down Arrows on the right.

Linking to Integrated Company Analysis
If you have the optional Zacks product, Integrated Company Analysis (ICA), you can have an instantaneous link to that module.
To access ICA from the Research Wizard:
-
Click the Snapshot button

-
When the Company Report window pops up, type in a ticker and then select the Integrated Company Analysis radio button.

Click the OK button and the Integrated Company Analysis program pops up in a separate window.
Summary
With the Research Wizard, any data is no more than a few mouse clicks away.
And with the Quick Tips featured in this article, you're now ready to get your information even faster.
Free Daily Picks from Zacks' Best Strategies
Plus, Formulas for Finding Them on Your Own
Try our Research Wizard stock-selection program for 2 weeks to access live picks from our proven strategies, modify existing screens, or test and create your own at the touch of a button. Absolutely free and no credit card needed.