How to Create Your Own Customized Data Items
While the Research Wizard has over 650 different fundamental data items to pick and choose from and up to 12 years of historical data, it also gives the user extraordinary flexibility to create his own customized items and ideas.
With the Research Wizard's Calculation Expression feature, you can compare an item to another item, combine different items together, you can even compare an item's value to its value from a different time period and so much more.
Calculation Expression Overview
Calculation Expressions are built by selecting items, time periods, operators and functions from the corresponding menus of the Calculation Expression window.
The Research Wizard provides a comprehensive set of operators and functions that you can use to create new items and complex calculations.
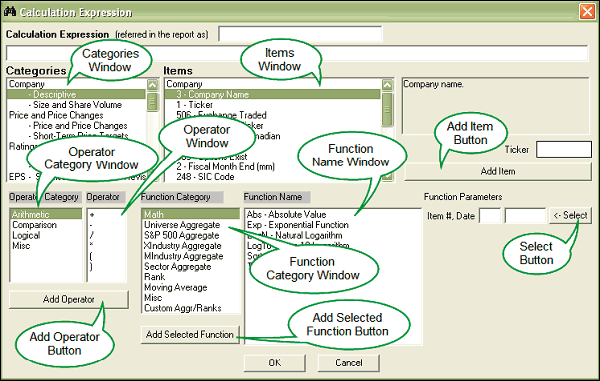
The Calculation Expression window is organized in much the same way as the main screening page, but it also has additional functionalities. (See the callouts in the image below.)
The Calculation Expression Window

Categories Window – includes the list of Categories and Sub-categories
Items Window – contains the corresponding Items of the Categories and Sub-categories
Time Period Box (aka the 'Recent' Drop-Down box) – allows you to select specific dates and periods
Add Item Button – inserts calculation into the Dialogue box or Data entry box
Operator Category Window – includes the list of operator categories
Operator Window – contains the corresponding operators
Add Operator Button – inserts the operator into the expression
Function Category Window – where additional functions can be applied to the selected items
Function Name Window – contains the corresponding functions of the Function Categories
Select Button of the Function Parameters Section – applies the selected functions to the desired item
Add Selected Function Button – inserts the desired applied functions into the calculation
The Calculation Window is quite intuitive, and once you use it a few times it will become very easy to understand.
Example #1: Comparing One Item to Another Item and Combining Different Items Together
Here's another great data feature that's not well known but extremely helpful.
In this example, let's compare a company's Cash Flow to its 5 Year Average Cash Flow.
-
From the Menu Bar, click on Screen and then select Screen By Calculation Expression.

Or as a shortcut; from the Tool Bar, click on the Screen By Calculation Expression button.

Either way, the Calculation Expression window pops up.
-
In the Categories window, under Ratios, select the 'Valuation' Sub-category.
-
And then in the Items window, select Cash Flow.

Note: At the end of this Item's Description, you'll see in parentheses it reads '(3 Yr)’. That means there's 3 Years of data (or 3 Yearly data points) for this item in this particular database that you can access. Other data frequencies you'll find are 'Wk' for Weeks, or 'Qtr' for Quarter or 'Mth' for Monthly and etc.
-
Then click the Add Item button beneath it, to add this to the expression.
(Or as a shortcut, you can simply double-click the item with your left mouse button.)
If done correctly, it should now read: i106

Note: You'll notice that each item has a numerical identifier in front of it. In this case, the item 'Cash Flow' has a numerical identifier of 106. The reason for these identifiers is because the database doesn't read the words Cash Flow for example, but rather the number used to identify the Cash Flow item. Once the item is added to the long dialogue box to build an expression, an 'i' followed by the identifying number will be shown. (The 'i' stands for item.) So i106, as shown in our calculation, means 'Cash Flow'.
-
Next, go down to the Operator Category window and select Comparison. Then in the Operator window, select the 'greater than' operator or '>'.

-
Then click the Add Operator button.
-
Your expression should now look like this (below).

-
Next, go back to the Categories window, and under the Growth Category (scroll up from the Ratio Category), select the Dividend and Book Sub-category.
-
Then in the Items window, select the 5 Year Average Cash Flow item.

-
Then click the Add Item button to add it to your expression.
If done correctly, it should now read: i106 > i170

-
Click the OK button at the bottom of the Calculation Expression window and then the Screen By Window is displayed (as shown below).
Then select ' = ' (equal to) operator
Select ' 1 = True ' (meaning you want the expression to be true)
Click OK

The Calculation Expression is now complete and is loaded in your Screening Criteria table. (See it below.)

Run this screen as it is or build upon it by adding more items.
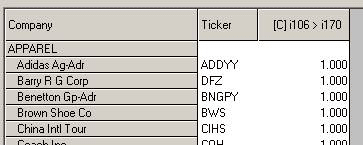
When we run the screen, the report will show all of the qualified stocks that meets this criteria. But the report will simply show ' 1 's for the value, meaning the condition is true, i.e., the current Cash Flow is greater than the 5 Year Average Cash Flow.

To make the report more meaningful, follow these steps:
-
In the Report Definition table, left click, then right click the cell that reads:
[C] i106 > i170.
A Menu will drop down. When it does, left-click on Delete and the column will disappear.

-
Next, in the Categories window, under Ratios, select the Valuation Sub-category.
-
Then, in the Items window, left-click the Cash Flow item one time (to highlight it) and the right-click it.
A Menu will then appear. When it does, left click on Add Database Item to Report.

-
The Report Column window pops up.
Keep the selection as Recent and click OK.

The Cash Flow will item will now be added to your Report.

-
Now go back to the Categories window and under the Growth Category, select the Dividend and Book Sub-category.
-
Then in the Items window, left-click one time (to highlight) the 5 Year Average Cash Flow item. Then right-click it.
When the Menu pops up, left-click on the Add Database Item to Report.
-
Then when the Report Column window pops up, keep the selection as Recent and click OK.

The 5 Year Average Cash Flow will now also be added to your report.

Now when you run your screen, the report will show the current Cash Flow and the 5 Year Average Cash Flow.

Combining Different Items Together
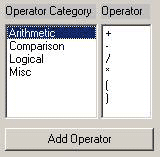
The procedure for combining different items together is similar to the steps you would take for comparing an item to another item (as illustrated in the above example). The only real difference would be in the Operators you would choose, such as the Arithmetic Operators (shown below) ...

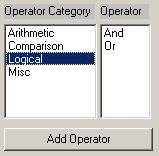
... and the Logical Operators (also shown below).

These are the most common Operators when combining Items together..
Example 2: Comparing an Item's Value to its Value from a Different Time Period
In this example, let's say you wanted to look for stocks that have a current Zacks Rank that is better (lower) than the Zacks Rank from one week ago.
-
From the Menu Bar, click on Screen and then select Screen By Calculation Expression.

Or as a shortcut; from the Tool Bar, click on the Screen By Calculation Expression button.

Either way, the Calculation Expression window pops up.
-
In the Categories window, under Ratings, select the 'Current' Sub-category.
-
And then in the Items window, select the Zacks Rank.

-
To complete the first part of your calculation, click on the Add Item button and the (recent) Zacks Rank (i.e., i192) will be added to the long dialogue box.
(Or as a shortcut, you can simply double-click the item.)
If you did it correctly, it should look like the illustration below.

-
Next, go down to the Operator Category window and select Comparison. Then in the Operator window, select the 'less than' operator or ' < ' .

-
Then click the Add Operator button.
-
Your expression should now look like this (below).

-
Next, go back to the Items window. The Zacks Rank should still be highlighted. (If not, left click to select it.)
-
Locate the Period box or 'Recent' drop-down box to the right of the Items window and select the 'Recent-nW' iteration.

Once the 'Recent-nW' is selected, do the following:
Click once in the drop-box
(The box turns white and you see a blinking cursor.)
-
Delete the ' n ' and replace it with the number ' 1 '
(If completed correctly, it should read 'Recent-1W'.)

Note: The -1W is a reference to the number of periods and the frequency or interval of the periods to choose from for the specified item within the selected database. W = Weekly, Q = Quarterly, Y = Yearly, etc.) Recent-1W means it's looking at one period before the most recent or current period (i.e., 1 Week before the Recent period).
-
Then click the Add Item button beneath it, to add this to the expression.
If done correctly, it should now read: i192 < i192[Recent-1W]

Which means, the current Zacks Rank is less than (i.e., better than) the Zacks Rank from 1 week ago.
-
Click the OK button at the bottom of the Calculation Expression window and then the Screen By Window is displayed (as shown below).
-
Then select ' = ' (equal to) operator
-
Select ' 1 = True ' (meaning you want the expression to be true)
-
Click OK

The Calculation Expression is now complete and is loaded in your Screening Criteria table. (See it below.)

Run this screen as it is or build upon it by adding more items.
-
To add the current or recent Zacks Rank and the Zacks Rank from 1 week ago to your report, do the following:
-
In the Report Definition table, left click, then right click the cell that reads:
[C] i192 < i192[Recent-1W].A Menu will drop down. When it does, left-click on Delete and the column will disappear.

-
Next, in the Categories window, under Ratings, select the Current.
-
In the Items window, left-click on the Zacks Rank one time to select it (highlight it), then right-click it.
A Menu will then appear. When it does, left click on Add Database Item to Report.

-
The Report Column window then pops up.
Keep the selection as Recent and click OK.

The Zacks Rank will now be added to your Report.

-
Go back to the Items window where the Zacks Rank is highlighted and right-click it again.
When the Menu pops up, left-click on Add Database Item to Report.
-
Then when the Report Column window pops up, drop down the Recent drop-down box and select the Recent-nW iteration.

Once the 'Recent-nW' is selected, do the following:
Click once in the drop-box
(The box turns white and you see a blinking cursor.)
Delete the ' n ' and replace it with the number ' 1 '
(If completed correctly, it should read 'Recent-1W' as shown below.)

Then click OK.
The Zacks Rank from 1 week ago will also now be displayed in your report.

Pretty cool.
Summary
The Calculation Expression feature is one of the most powerful and versatile parts of the Research Wizard program.
Once you've created a few calculated expressions on your own, you'll find yourself using it again and again to create customized screens and reports and to produce virtually any kind of data you can imagine.
Free Daily Picks from Zacks' Best Strategies
Plus, Formulas for Finding Them on Your Own
Try our Research Wizard stock-selection program for 2 weeks to access live picks from our proven strategies, modify existing screens, or test and create your own at the touch of a button. Absolutely free and no credit card needed.