The Zacks Rank is one the best ways to find stocks that outperform.
And since an Industry is nothing more that a group of stocks in the same business – finding those groups with the best average Zacks Rank will help you find the best stocks in the groups that should outperform.
In fact, in our studies we've found that the 'top' 50% of industries outperformed those in the 'bottom' half of the industries by a ratio of nearly 4 to 1, with the greatest gains coming from the best 10% of industries.
This being said, it's important to focus in on the best groups for the greatest probability of success.
Searching for the Top 10% of Zacks Ranked Industries
Screening for the Top 10% of Zacks Ranked Industries is easy with the Research Wizard.
-
Go to Screen on your Menu Bar and select Screen By Calculation Expression.

Or click on the Screen By Calculation Expression button on the Tool Bar.

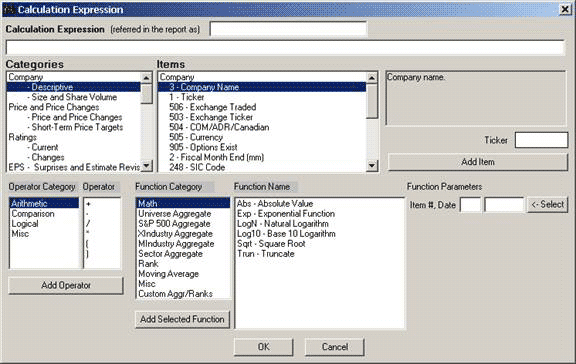
The Calculation Expression Window will pop up.

-
In the Categories Window select Ratings. It'll then default to the Current Sub-category.
In the Items Window, under Company Ratings (at the top), the Zacks Rank should be highlighted. (See below.)

-
Next, in the Function Category Window, select XIndustry Aggregate.

-
Then, in the Function Name Window, select XIndMean – XIndustry-Mean.

-
To the right of that Window is the Function Parameters section. Click the 'Select' button and you'll see the Item # and Date boxes populate with 192 and Recent. (192 is the numerical identifier for the Zacks Rank and Recent means most recent or current.)

Note: For more information on the Calculation Expression feature, please refer to Tips and Tricks Issue #5 (www.zacksrw.com/Tips_Tricks5.asp), where we explain the different features and functions of the Calculation Expression Window.
-
Then click the Add Selected Function button under the Function Category Window.

-
The Calculation Expression: GrAgg117(i192) will be placed in the long dialogue box at the top of the Window. (See below.)

Almost done.
-
Click in that dialogue box right after the first parentheses. (Your cursor should be blinking.)
Then, type in ' 1 '. And then an asterisk ' * '.
The Expression should now read: GrAgg117A(1*i192)

Note: Why did we do that? We added the 1* (or 1 times -- i.e. multiply by) so we could turn the Average Zacks Rank into a decimal number instead of a whole number. This allows us to distinguish between numbers such as 2.53 and 2.96. If we kept them as whole numbers, they would both be considered a 2. But of course, as an investor, an average Zacks Rank of 2.53 is better than an average Zacks Rank of 2.96. And this will let you see that.
-
Click the OK button at the bottom of the Window and the Screen By Window will then pop up.

-
Drop down the Operator Box and choose the BotXIndA #.
And then type in 21 in the Box off to the right.

Note: What did we just do?
The BotXIndA # means:
Bot = Bottom
XInd = X (or Expanded) Industries
A = Average
So we searching for the Bottom X Industries with the lowest average Zacks Rank Number. Why the bottom number? Because for the Zacks Rank, the lower number is the better number, e.g., a Zacks Rank 1 is better than a 5. So by looking for the bottom number we'll get Industries with numerical values of 1's and 2's and etc. (lower numbers), as opposed to 4's and 5's (higher numbers).
Why 21?
Since there's roughly 210 X Industries, we limited our search to the bottom 21 Industries with the lowest average Zacks Rank. (That's roughly 10% of the X Industries.)
-
Click the OK button and the Calculation is now added to the Screen
Definition table. If you did it right, it should look like the image below.

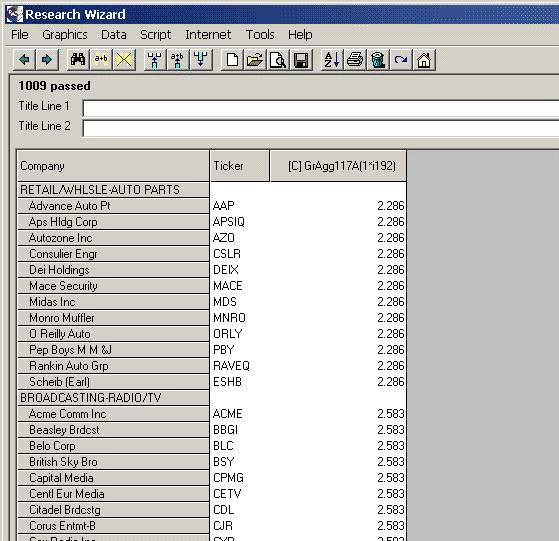
When you click the Run Query button, you'll now generate a list of stocks that are only from the 21 X Industries with the best average Zacks Rank.
Tip: Remember, as a default, the Report is organized by the M or Medium sized Industry. Be sure to Organize this report by its X Industry. Just follow these steps below.
-
On the Menu Bar, click on Data, and then select Organize/Sort.

Or click on the Organize/Sort Report button on the Tool Bar.

-
The Organize/Sort Window will then pop up.
In the Organize by drop-down box, select the X Industry.

The click the OK button.
The report will now be organized by the X Industry.

In the example above, the Retail/Wholesale-Auto Parts X Industry has an average Zacks Rank of 2.2286 while the Broadcasting-Radio/TV X Industry has an average Zacks Rank of 2.583, and etc.
Tip: If you'd like to change the column header in the report that currently reads: GrAgg117(1*i192) to something more friendly (and useful) like: Avg. Zacks Rank X Industry, it's easy to do.
-
Go back to the 'main' page by clicking the Back button in the upper left corner.

-
Then go down to the Report Definition table and left click to select the column header that reads: GrAgg117(1*i192).
-
Then right click it and select Modify.

The Modify Column Window will then pop up.

-
On Line 1, delete the text that's in there and type: Avg. Zacks Rank.
On Line 2, type X Ind.
And if you want to shorten the number to only two places to the right of the decimal instead of three, select the #0.00 iteration in the Column Format window.
If you did it correctly, the Window will look like this.

-
Then click the OK button.
Your new column header (Avg. Zacks Rank, X Ind.) should now be displayed.

Note: In this example, we screened for the 'top' (or best) 21 (10%) of X Industries. But you can use this same procedure to screen for the worst X Industries. Or anything in between. You of course can also do this for the M (Medium sized) Industries and Sectors as well.
Creating a Screen to See What the Average Zacks Rank is for ALL of the X Industries
You can also create a screen and report to see what the average Zacks Rank is for all of the X Industries, without having all of the stocks displayed in your report.
You might want to do this to check up on a stock and see what the average Zacks Rank is for its respective Industry. Or you might want to run this screen/report each week or month, etc., to see if the average Zacks Rank for an industry has improved or not since the last time you ran it.
The beginning portion of this screen comes loaded with the program. Just follow these steps.
(Clear all of your criteria from the last example.)
-
Go to Screen on your Menu Bar and then select Open Screen Definition.

The Open Screen Definition Window pops up.
-
Double-click on the SoW folder. Then select the screen named: one_rep_x_industry.und and click Open.

The screen will now be loaded into your Screen Definition table (along with the default report of the same name) in the Report Definition table.

Note: This screen and report were created specifically to generate only one stock per Industry when running the report. Why? Because, since the Research Wizard is a stock screening tool, even if you're ranking or reporting on groups, it'll always assume you're interested in the stocks within those groups as well. But if you're really only interested in a macro view (generating aggregate valuations for a group, i.e., Industry or Sector), you can limit the number of stocks displayed in the report to one for example.
Why not just have the report display no stocks at all and just provide the aggregate values? Simply put, in order for the group's aggregate values to be displayed in a report, a stock needs to represent that group so as the group itself will be displayed. If no stock from that group passes the screen, the group (Industry or Sector) it resides in will not be displayed in the report.
So, the screen and report automatically selects the one stock with the largest Market Value to represent that group.
More on this when we complete the screen/report.
-
Now it's time to add the average Zacks Rank to the report.
Click on Report on the Menu Bar and select Add Calculation Expression.

Or click on the Add Calculation Expression button on the Tool Bar.

The Calculation Expression Window will pop up.

-
In the Categories Window select Ratings. It'll then default to the Current Sub-category.
In the Items Window, under Company Ratings (at the top), the Zacks Rank should be highlighted. (See below.)

-
Next, in the Function Category Window, select XIndustry Aggregate.

-
Then, in the Function Name Window, select XIndMean – XIndustry-Mean.

-
To the right of that Window is the Function Parameters section. Click the 'Select' button and you'll see the Item # and Date boxes populate with 192 and Recent.

-
Then click the Add Selected Function button under the Function Category Window.

-
The Calculation Expression: GrAgg117(i192) will be placed in the long dialogue box at the top of the Window. (See below.)

Almost done.
-
Click in that dialogue box right after the first parentheses. (Your cursor should be blinking.)
Then, type in ' 1 '. And then an asterisk ' * '.
The Expression should now read: GrAgg117A(1*i192)

You can also change the way this item will appear in the report by typing in what you want displayed in the top (smaller) dialogue box next to the words '(referred in the report as)'.
For this example, let's type in: Avg. Zacks Rank X Ind.

-
Then click the OK button at the bottom of the Window and this item will be added to the Report Definition table.

Tip: If you forget to do this or decide later on you want to change it again, just follow the steps we went over earlier to change the way a column header will be displayed in your report.
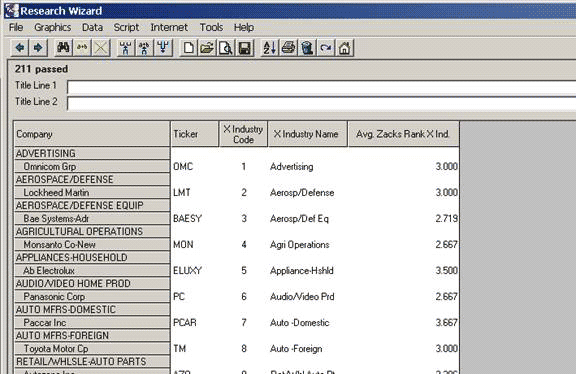
When you run your screen/report (click the Run Query button), the report will display the X Industry Code (number), the X Industry Name and the Average Zacks Rank for the X Industry.

Note: The tickers displayed, for all intents and purposes, are irrelevant for this report. Why? Because as explained earlier, it's only displayed because in order for the Industry to be displayed, it needs to be represented by a stock within that group.
For example: OMC (Omnicom) under the Advertising Industry, is only displayed because I chose that the largest market cap stock would represent each group. But even if I chose to have the smallest market cap stock represent each group, the average Zacks Rank for the group itself (a 3 for the Advertising Industry), would not be affected.
Now let's make this report even more useful by sorting it from the best X Industries at the top (lowest numbers) to the worst X Industries at the bottom (highest numbers).
-
Double-click on column header that reads: Avg. Zacks Rank X Ind.
The first time you do it, it will quick sort in ascending order with the larger numbers at the top. Double-click it again and this time it'll sort in descending order with the smaller numbers at the top. (This is what we want.)
If you're so inclined, you can even choose to hide the individual stock tickers.
Just hover your mouse over the line between the column headers 'Ticker' and 'X Industry Code'.Then left click and hold it down while you drag it over to the left -- essentially coving up the Ticker column with the X Industry Code column.

In the above example, the best Zacks Rank Industry at the time of this report shows it's Food-Flour and Grain with an average Zacks Rank of 1.
And be sure to save your custom screens and reports so you can retrieve them again in the future with a simple click of a button.
To save then, go back to the 'main' page and then go to Screen and then Report on your Menu Bar and save them.
Summary
Supercharge your screening today by focusing on the best stocks within the best Sectors and Industries.
Statistics have shown that roughly half of a stocks price movement can be directly attributed to the group that it's in.
Start taking advantage of this today.
Free Daily Picks from Zacks' Best Strategies
Plus, Formulas for Finding Them on Your Own
Try our Research Wizard stock-selection program for 2 weeks to access live picks from our proven strategies, modify existing screens, or test and create your own at the touch of a button. Absolutely free and no credit card needed.