Whether you run multiple screens every day or several screens every once in a while, you can automate your screening routines with the Research Wizard's Scripting feature.
Instead of opening each screen one at a time and running it, then printing it or exporting it to Excel, you can simply open up one script and the program will do all of the rest for you.
It's quick, it's easy, and a great time saver.
Let's take a look.
Building Your Script
Everybody has their favorite screens. And I'm going to demonstrate how to build a script with four favorite screens of my own.
bt_sow_big_money_zacks
bt_sow_filtered_zacks_rank5
bt_sow_r_squared_eps_growth
bt_sow_toxic_stocks2 (short strategy)
-
On your Menu Bar, click on Script and then New Script

The Research Wizard Script window will pop up.

-
The first 'Operation' is to choose a Screen Definition to open.
-
To the right of the Saved Screen Definition box, click on the little button with the 3 dots (ellipsis) on it.
The Screen Definition window will pop up.

-
Go find your first screen you want to add to the script. In this example, double-click the SoW folder and then locate the screen labeled, bt_sow_big_money_zacks.und, select it, and click Open.
Once you do, it'll be put into the Saved Screen Definition box.

-
Click the Add button and you'll see your screen added to the Script commands window. (See below.)

-
Next, it asks if you want to open a ticker list. For this example, we'll pass over this option.
Note: the scripting process lets you open up screens, ticker list or reports. Each and every one of the above files, separately or together, can be put into a script.
The next option is to open a Report Definition. Since the Screens we're opening in this example, already have a predefined report attached to them, we can skip over this step as well. But if you'd to have a different report or specially created report opened, complete this step before moving one.
-
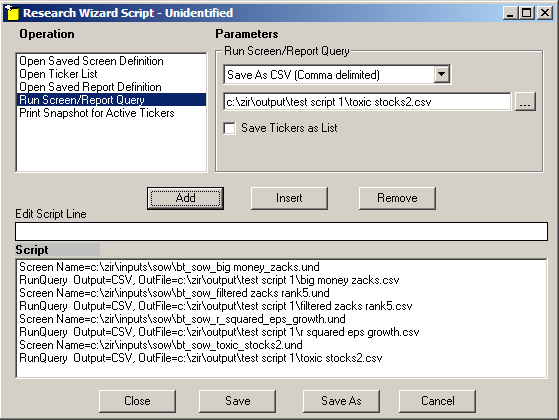
The next option is to Run Screen/Report Query. (See below.)

This command will direct the Research Wizard to start the Run Query command.
You have an option as to what the Research Wizard will do with this Report; it will either Print it, or Export the data to a file (Tab delimited, Space delimited, or Comma delimited - common Excel file format) and or save the tickers that come thru as a ticker list.
The Print option is easy and self explanatory. (It will be sent to your printer and printed out.)
Instead, let's explore the Save As CSV (Comma delimited) option. So select the Save as CSV option.
You'll see a new dialogue box displayed beneath it.

-
Click the little button to the right of the box and either find the file you want the report output to go to or create a new Report where the screen results will be exported to. For this example, we're going to create a new report and folder to keep them in.
-
Click the little button to the right of the box and the Save as CSV
(Comma delimited) window will pop up.
-
Then select the Create New Folder button to create a folder we can put all of this scripts reports in. (You'll see why we do this convenience step later.)
Then create a name for your folder (let's call this 'test script 1')...

... and then doubl-click it with your left mouse so it becomes the active directory, i.e., it gets put into the Save In: box.

-
Then, in the File Name box at the bottom, type in the file name you want to call CSV file. We'll call this one 'big money zacks'. (Then click Save.)

-
The newly named file will populate the box. Then just click the Add button to add it to your Script commands. (If you did it correctly, the big money zacks csv file will be the second command.) (See below.)
Note: If you also selected the 'Save Tickers as List' option, repeat the above steps for this as well, i.e., create a ticker list name where the tickers will get exported to.

-
-
The last Operation option is to print the Zacks Company Snapshot Reports for each ticker if you'd like. (We'll pass over this as well for this example. But if you selected it, every ticker that passes this screen (and ultimately every screen in this script) will get a Zacks Company Snapshot Report printed.)
-
The first set of commands for this script (open Screen, Run Query, Export results to Excel) is complete. Do the same thing for the other screens you want to add to this script.
-
Click the 'Open Saved Screen Definition' option in the Operation window.

-
Find the screen you next want to add to your Script. For this example, it's bt_sow_filtered_zacks_rank5.
Select it.
Click Open.
Then click the Add button to add it to your list of commands.

-
Then select the Run Screen/Report Query option.
Under the Parameters / Saved Screen Definition section, select Save as CSV (Comma delimited).
Then click the button so the Save as CSV window pops up.
Double-click the 'test script 1' folder.
Create a name for then CSV file. For example: filtered zacks rank5.
Then click Save.
Then lastly, click the Add button. This will now be added to the list of script commands. (If you did it correctly, your script so far should look like the image below.)

-
Repeat these steps for the rest of the screens you wants added, e.g., bt_sow_r_squared_eps_growth and bt_sow_toxic_stocks_2.
Once your script is completed, it should look like this. (See below.)

Now it's time to save it.
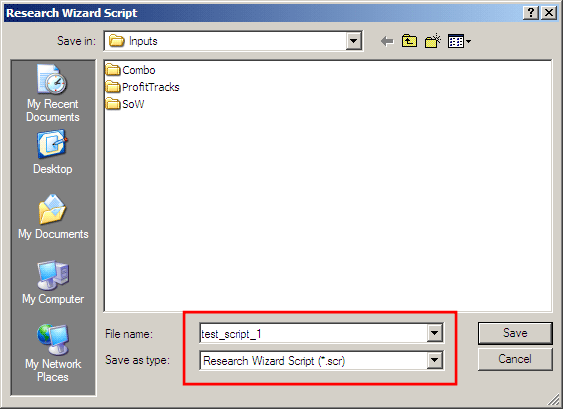
Click the Save button and then give it a name. We'll call this, test_script_1.
Then click Save.

Note: The script file will be stored in your Inputs folder. The file extension has a .scr suffix. (A screen has a .und extension. And a Report has a .rpd extension.)
Then Click the Close button to close the window.
Now you're ready to run your Script.
-
On your Menu Bar, select Script, then Run Script.

-
Select the script you want to run. (In this example, it's test_script_1.scr.)

-
The Research Wizard will automatically Open and Run and Export each screens output file (report with tickers) to the designated CSV files. (And as stipulated earlier, if you chose to have the Zacks Company Snapshot Reports printed, each report for every stock will be sent to your printer to get printed.)
-
Lastly, to retrieve the output files for all four of these screens, go to your:
C Drive:
Then double-click your ZIR folder
Then double-click your OUTPUT folder
Then double-click your 'test script 1' folder
-
Then click Edit, Select All (See below.)

-
When all the files are highlighted, right click in that window and select Open. (See below.) (They'll all open at once.)

Note: To shorten the above steps to open those output files, you can create a shortcut on your Desktop for the 'test script 1' folder.
Once you're in your C:\ZIR\OUTPUT directory, right-click on the 'test script 1' folder. Then hover over 'Send To' from the resulting
Menu. And then finally, left-click on the Desktop (Create Shortcut) option. (See below,)

A 'test script 1' shortcut icon will be placed on your desktop so you'll be able to access that folder with one click.

Summary
Automating your screening routines will be a convenience you'll be able to enjoy over and over again.
One of the key's to stock picking and trading success is to stay on top of your portfolio, which includes monitoring your current holdings, rebalancing your portfolio and searching for new stocks that qualify your screens.
Life can get busy. So the easier and more convenient you can make your daily tasks (not just in stocks but in life) the more likely you'll do it.
Try automating your screening and monitoring process today. And start benefiting from this time saving feature immediately.
Free Daily Picks from Zacks' Best Strategies
Plus, Formulas for Finding Them on Your Own
Try our Research Wizard stock-selection program for 2 weeks to access live picks from our proven strategies, modify existing screens, or test and create your own at the touch of a button. Absolutely free and no credit card needed.