Backtesting is one of the only ways to see how successful your screening strategies or trading strategies are before you place a trade. With over 8,500 stocks to choose from, it's essential to know if your strategy has success at finding the good ones.
But of course, just because you narrowed down 8,500 stocks to only a handful, does not necessarily mean that you've picked the best stocks on the planet. You might have picked the worst ones.
But how will you know? Backtesting.
Once you've created a screen, you can backtest it to see how good (or bad) your screening strategy has performed. In other words, does your screen generally find stocks that go up once they've been identified or does your screen generally find stocks that go down once they've been identified? This is important information to know.
And in this week's Tips and Tricks, we'll go over how to read the backtest reports so you can make a more informed decision on your screens results.
How to Run a Backtest
Let's run a backtest on one of the saved screens that comes loaded with the Research Wizard.
-
On the Research Wizard Menu Bar, select Backtest.

The Backtest Screen Definition window will then pop up.

Note: If you have not subscribed to the Advanced Backtester, you will not see the Advanced Backtesting functionality (currently 'greyed out' in this image).
If you have subscribed to the Advanced Backtester, the Advanced Backtesting functionality will be grey out while in internet mode, i.e., 'Backtesting – Internet Mode'. You need to be in 'Backtesting – Local Mode', to access these features. Once in Local Mode, the features will be active and in black.
More on Advanced Backtesting in a future Tips and Tricks.
-
Next, click the 'list' button
 to the right of the long Strategy box.
The Screen Definition Window will pop up.

-
For this example, we'll be backtesting the Filtered Zacks Rank 2 strategy.
-
Double-left-click the SoW folder
-
Select the bt_sow_filtered_zacks_rank2 strategy and click the Open button

Note: The prefix 'bt_sow' is simply a way we used to distinguish if a screen was specifically created to be a backtestable strategy. Some of the screens were designed to be trading strategies whereas others were designed as unique ways to screens for stocks. Some of the screens access items in 'non-backtestable' databases and as such cannot be backtested. When you see the bt profix, that means it can definitely be backtested. However, It should also be noted that some screens without the 'bt' prefix can also be backtested. But some others cannot. But again, all the ones with a 'bt' prefix can be backtested.
-
-
The screen will now be loaded in the Strategy box.

-
Next, identify the time span for testing your strategy, the Holding Period and the Benchmark to compare against.
Time Span
-
In the From box, select the beginning date you want to test your strategy from.
(Let's use 01/02/2009.)
-
In the To box, select the date you want to test your strategy to. (Select 05/15/2009).

Holding Period
-
From the Holding Period drop-down menu, select a Holding Period. (There are many different Holding Periods to choose from. For this example we'll choose 1 Week.)

Benchmark
-
Select a Benchmark from the drop-down Menu. (We'll keep the default S&P 500.)

Note: The dates in the From box and the To boxes are always start dates. For example, the To box reads, 05/15/2009. Since we're using a 1 Week Holding Period, that holding period actually ends a week later on 05/22/2009. If we were using a 2 Week Holding Period, that period would end on 05/29/02009.
-
-
Once your backtest is set up, click the Run button to see how your strategy has performed.
You'll see a report displayed complete with a performance chart and your strategy's statistics.

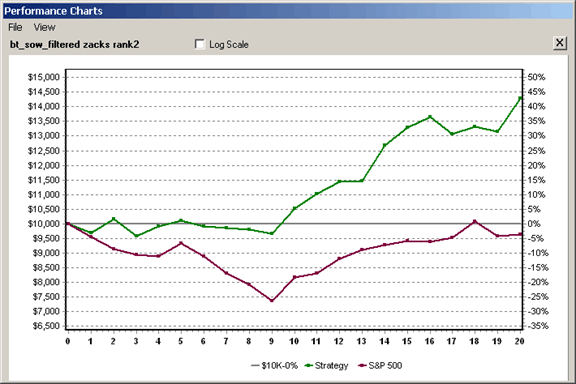
Performance Charts
The Performance Chart shows how your strategy performed over the test period using a hypothetical $10,000 starting equity.


Left click on Performance Charts and the Performance Chart will re-appear.
Main Backtest Report
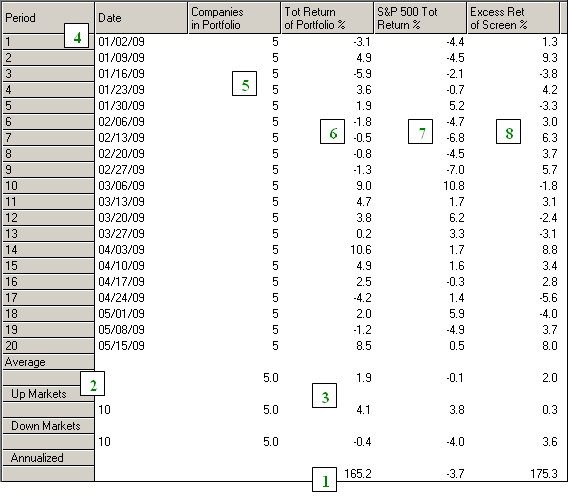
The image below is a snapshot of the first six columns of the strategy report.

Strategy Report Explanation
-
Displays the annualized returns for your backtest report.
-
Indicates the number of up and down markets (periods) seen by the MARKET, i.e., the benchmark selected – in this case the S&P 500), during your test period.
-
Specifies the average return of your strategy and the benchmark during your test period, including the average return when the market was up and the average return when the market was down. It also includes other summary statistics such as the average number of stocks held, and etc.
-
List the individual holding periods in your test along with the corresponding start dates.
-
Specifies the number of stocks that passed your screen in each period. In this example, this screen was designed to always pick five stocks.
-
Displays the strategy's periodic returns.
-
Indicates the benchmark's periodic returns.
-
Lists the excess returns (or deficit returns) of the strategy compared to the benchmark.
Statistics Table
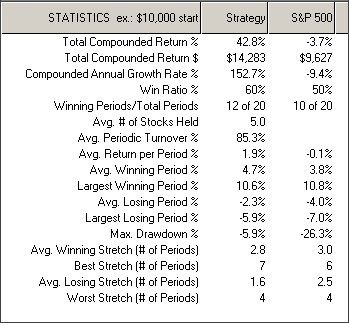
The snapshot below is of the statistics table. This displays the return and risk metrics.

The table includes:
Total Compounded Return % – performance for the test period.
Compounded Annual Growth Rate % – a measure that translates performance into a yearly return.
-
If the test period was for an entire year, the Total Compounded Return and the Compounded Annual Growth Rate would be the same.
-
If the test period was for more than a year (five years for example), or less than a year (5 months for example) the Compounded Annual Growth Rate would show the annual return (i.e., how the 5-year total return breaks down into annual returns or how the 5 month return would look on an annual basis if the same type of results continued for the rest of the year).
Win Ratio – winning periods divided by the total number of periods in the test. (This shows how often your strategy's portfolio wins and how often it loses.)
Winning Periods/Total Periods – number of winning periods out of the total number of periods in the test.
Avg. # of Stocks Held – average number of stocks help in the portfolio each period.
Avg. Periodic Turnover % - percentage of turnover (stocks sold and new stocks bought) in the portfolio each period. For example, if the portfolio held on average of 6 stocks each period and you replaced on average of 3 stocks each period (sold 3 stocks for 3 new ones), the Turnover % would be 50%.
Avg. Return per Period % - average return for the portfolio on a periodic basis.
Avg. Winning Period % and Avg. Losing Period % - average win or loss on a periodic basis.
Largest Winning Period % and Largest Losing Period % – largest win or loss in a single period.
Max Drawdown % – the maximum drawdown, i.e., the largest drawdown in equity.
This can be a single period or a series of losing periods (and not necessarily in a row). To further define it, it's the largest equity pullback from a previous equity peak. In short, it measures how much an investor might have seen his equity drop by if he had traded the strategy during that time period. This could mean a drop in profit or a drop in starting equity depending on when you began.
In the above example, the Max Drawdown happens to be the same as the Largest Losing Period.
However, the Max Drawdown can be larger. As stated earlier, it can be a single period or a series of losing periods, in a row or otherwise. For example:
-
If in one period the strategy was -3%, and the next period the strategy was -3%, that's a total of -6%.
-
If the strategy then gained 2%, the total is now only -4%. (And the Maximum Drawdown at this point would be recorded as -6% since that was the largest pullback up to that time.)
-
But, if the next period was -3%, and the strategy then hit a winning streak, the Max Drawdown would be recorded as -7%.
Final Calculation: -3% plus -3% plus 2% plus -3% = -7% total. And that would be your Max Drawdown.
This is a good statistic to know so you can decide whether or not this risk level is an acceptable risk level for your trading.
Other good risk measurements are the Average Winning Stretch (# of Periods) and Average Losing Stretch (# of Periods) along with the Best Stretch (# of Periods) and the Worst Stretch (# of Periods). These measurements illustrate the number of consecutive Winning Periods or Losing Periods.
Tip: These measurements are helpful in identifying the patterns of winning periods and losing periods. If your strategy happens to go through a losing period, you can see the historical 'norm' and the probability of success for the next period or periods.
Viewing the Backtest Period Details Window for Individual Periods
You can also see the stocks that came thru in your historical periods.
-
To view the Backtest Period Details, left click on any of the individual periods and then right click the period.
A small menu will pop up.

-
Select Backtest Period Details. (See the image above.)
Once you do, the Backtest Period Details window is then displayed. (See below.)

In this window, you can see which stocks qualified in each historical period as well as how the stocks performed individually.
Also, by clicking on any one of the tickers, it'll show you how often that stock came thru your screen during the test period and if any of them were in consecutive periods. (See the image below.)

You can also export this data to Excel by clicking on the Export to Excel button.
Pull Up a Company Snapshot Report from the Details Window
You can also pull up a stock's Company Snapshot Report from this window as well.
-
Select a stock by left clicking it.
-
Then left click on Ticker Data.

To close the Backtest Period Details window, just click Close or click the 'X' in the upper right corner of the window.
Viewing the Backtest Period Details Window for All Periods
The Backtest Period Details window can be displayed for each period separately, or you can pull up a Details Window with all of the periods in it.
-
To pull up a Details Window for all the periods, left-click the Annualized Return Number in the main Backtest Report, and then right click it.
A small menu will pop up.
-
Then select Backtest Period Details.

A window with all of the periods is displayed. (See below.)

You can also export all of this data to Excel by clicking on the Export to Excel button.
To close the Backtest Period Details window, just click Close or click the 'X' in the upper right corner of the window.
Summary
Stop guessing how good or bad a particular stock picking strategy is and start knowing. Once again, with backtesting, you can see how successful your stock picking strategy has performed in the past, so you'll have a better idea as to what your probability of success will be now and in the future.
Of course, past performance is no guarantee of future results, but what else do you have to go by?
If you saw that a stock picking strategy did nothing but lose money year after year, period after period, stock after stock, over and over again, there's probably no way you would want to trade that strategy or use that screen to pick stocks to add to your portfolio.
Why? Because the strategy has proven to pick unprofitable stocks. While it could always turn around and start picking winners, it may also continue to pick losing stocks the way it's always done in the past.
On the other hand, what if you saw a strategy perform great year after year and period after period? Of course you'd want to trade that strategy! And that's because it's proven to be a profitable trading strategy.
And while it could start picking losers all of a sudden, it may also continue to pick winning stocks just like it had been doing over and over before. Keep in mind, a screening and backtesting program isn't a 'box of magic'. But it's a great way to see what works and what doesn't before you put your money at risk!
In you're not backtesting, you're just guessing.
Start backtesting your screens today.
Free Daily Picks from Zacks' Best Strategies
Plus, Formulas for Finding Them on Your Own
Try our Research Wizard stock-selection program for 2 weeks to access live picks from our proven strategies, modify existing screens, or test and create your own at the touch of a button. Absolutely free and no credit card needed.