Backtesting is one of the only ways to see how successful your trading strategies are BEFORE you place a trade.
And testing your strategies over many different time periods is critical to making sure your strategies are robust enough to make money in all markets no matter when you start using it.
For example: if your strategy is to buy stocks at the beginning of each month and hang onto them for the remainder of the month; it'd also be a good idea to see what would happen if you picked your stocks in the second week of the month or the third week of the month etc., and held onto those picks for a different set of four week periods.
This is good stuff to know. Why? Because depending on when you run your screen, your strategy could pick a different list of stocks. And this list might be slightly (or meaningfully) different. And these different lists will be held over different sets of four week periods.
So if your strategies can do well no matter what and when -- now you know you've got something special -- a proven, profitable and repeatable way to pick winning stocks.
While some of this can be done individually in the standard backtester in the Research Wizard, the advanced backtester, lets you test your strategy over multiple start dates with only one click of the mouse instead of setting up separate tests for each new start date you want to test it over.
And in the advanced backtester, each new start date (and performance graph) will be displayed on the same chart so you can easily see the difference between these different start dates. In addition to that, it'll display the average performance of the strategy using all of the tested start dates.
This is great for the casual backtester who simply wants to see how something has done over time as quickly and easily as possible. It's also perfect for the advanced strategy builder who needs answers fast, as different screens and ideas are constantly being tested and re-tested to find advantages over the market.
Let's take a look.
Note: Make sure you are enabled for the Advanced Backtester and have downloaded the application. If you need to download the Advanced Backtester, see the instructions at the end of this article.
Automated Robustness Analysis
('Best' Case / 'Worst' Case Analysis)
Set-Up
-
Go to Tools on your Menu Bar. (If Advanced Backtesting – Local Mode is not 'checked', click it with your left mouse to do so.)

-
A message will then pop up that that reads (see below):

Click Yes.
Your Research Wizard program should automatically shut-down and then re-open. If it does not re-open automatically, just open it up again like you would normally.
-
If you did it correctly, you'll notice that if you go to Tools again, this time, Advanced Backtesting – Local Mode is checked.

Ready to Go
-
On the Research Wizard Menu Bar, click on Backtest.

Once you do, the Advanced Backtesting window will pop up.

-
To find a strategy you want to test, left clikc the 'list' button to the right of the Strategy box.
Once you do, the Screen Definition window pops up.

-
For this demonstration, let's grab the bt_sow_r_squared_eps_growth screen.
-
double-click on the SoW folder
-
select the screen titled: bt_sow_r_squared_eps_growth
-
then click Open
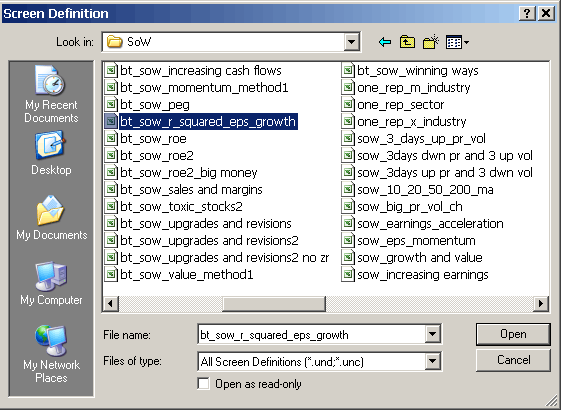
The screen will now be loaded in the Strategy box. (See below.)
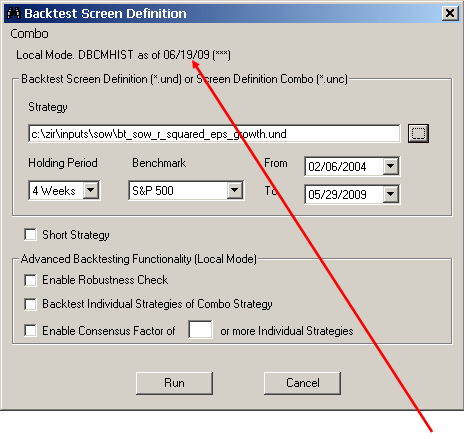
Note: At the top of the window, it'll show you how up-to-date your downloaded DBCMHIST database is. (The Advanced Backtester works in local mode only and will access the downloaded DBCMHIST database. When in internet mode, it always automatically accesses the most up-to-date backtesting database. But when in local mode, you'll have to manually update your database. The date at the top will always let you know how current your downloaded database is. Also, if your database is more that two weeks old, a message will pop up each time you open the Research Wizard program reminding you of this.
-
Next, you'll set up the backtesting window like you would any other screen.
-
choose the date range (let's use 12/28/07 thru 6/12/09 and get the meat of the bear market)
-
the Holding Period (let's use 4 weeks)
Note: If you select a Holding Period of 12 Weeks, 24 Weeks or 52 Weeks, an option to display 'up to 12 wks' is made available. (As a default, it will display up to 4 start dates at a time. Of course, if you select a 2 Week Holding Period, it will display 2 start dates.) If you click the radio button that reads 'up to 12 wks', the backtest report will produce the returns of up to 12 different start dates to analyze – both the details and the graphical chart overlays. This will become clearer as we get further into this example.

-
continue the set-up by selecting the Benchmark for comparison (we'll keep the S&P 500)
-
-
Then click the Enable Robustness Check box.
The completed set-up is below.

Note: We'll cover the Combo Strategy and Consensus Factor in a future Tips and Tricks article. But if you'd like to explore these features on your own, please watch the Advanced Backtesting tutorial at: zacksrw.com/features.html
-
Click Run, and the Backtester begins testing your strategy.
You'll see a status window pop up (see below). It displays the elapsed time, the percentage of the test that is completed so far and you'll see approximately how much time is left until your test is finished. Note that in the upper left corner of the window, it'll show which 'Run' it's on. In this example, we're doing a robustness test using a 4 week rebalancing period. So there are 4 possible start dates to consider which means it'll make four different backtest 'runs'. In the screenshot below, it shows the test was 35% complete, and it was on Run 2 of 4. The Period denotation in the upper right also shows what period it's on within that run to further determine how close you are in completing the test.

Once the backtest is done, your typical backtest report window will pop up.
But there will be a few differences.
(By the way, this strategy did fantastic considering the historic bear market we were in. It kept itself positive even while the market was collapsing in 2008. And it started to turn it up even more in 2009.)
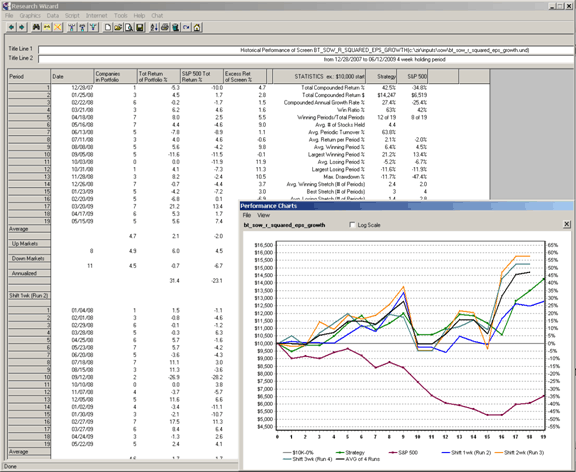
Let's first look at the chart.
To enlarge the chart, double-click on the chart's Title Bar to make it full screen. Then double-click it again to bring it back to normal.
You can also move it by dragging it or incrementally enlarge it by grabbing one of the sides or corners and pulling it.
You'll notice on this chart (unlike a regular backtest chart), it has multiple performance lines.
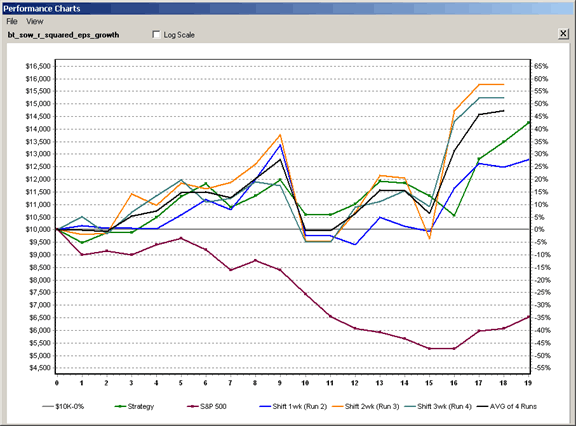
You'll notice at the bottom, there is a legend. Each line is identified.
For example:
-
The Horizontal line represents your starting equity/performance
point, i.e., $10K-0%.
-
Strategy (in green) is the first start date.
-
S&P 500 (in maroon) is the benchmark, S&P 500
-
Shift 1wk (Run 2) (in blue) is the second start date, i.e., 1 wk later
-
Shift 2wk (Run 3) (orange) is the third start date, i.e., 2 wks later
-
Shift 3wk (Run 4) (teal) is the fourth start date, i.e., 3 wks later
-
AVG of 4 Runs (black) is the average performance of all four different start dates.
Viewing a Particular Run or Study
To view a particular run or study, select (or deselect) the different strategy Studies by clicking on View on the Menu Bar of the chart window. The selected strategies are then displayed. (See below.)
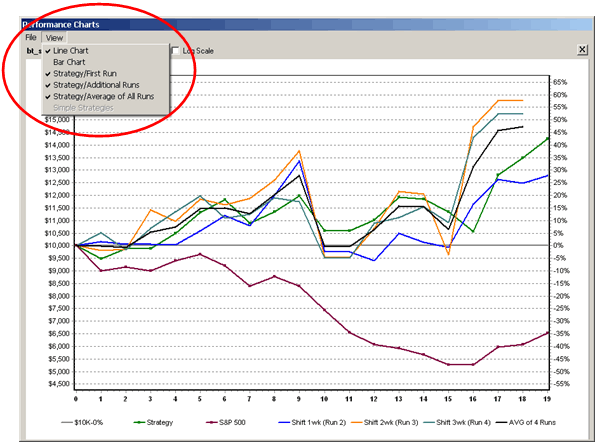
By leaving only the Strategy/First Run checked, the performance chart of only the first start date is shown (along with the S&P 500).
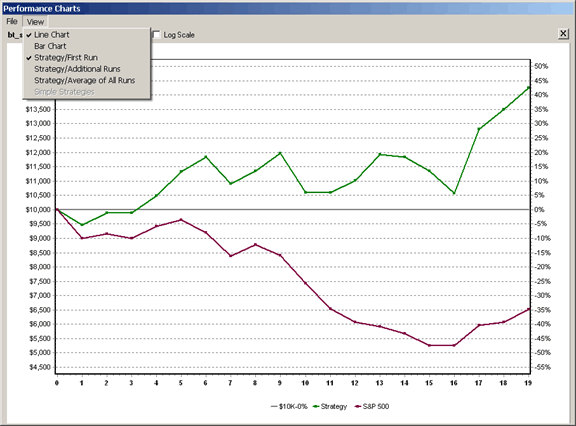
By selecting the Strategy/Additional Runs to be displayed as well, the performance charts of all the strategy's start dates are displayed along with the S&P 500.
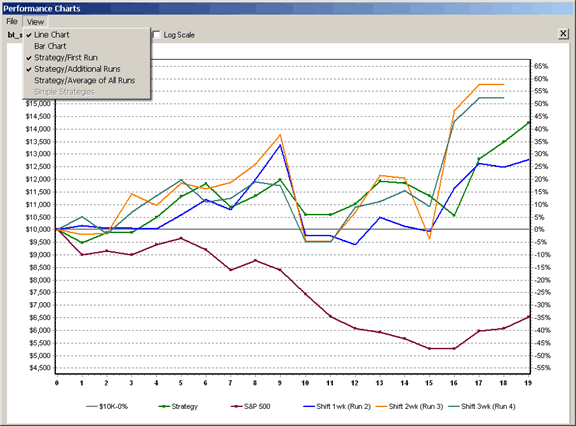
You can also add the average of all the runs (Strategy/Average of All Runs) to your display as well. Or you can isolate the average run and view it separately (as in the image below).
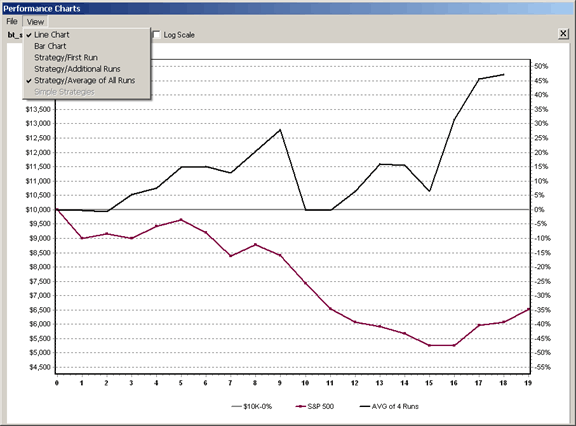
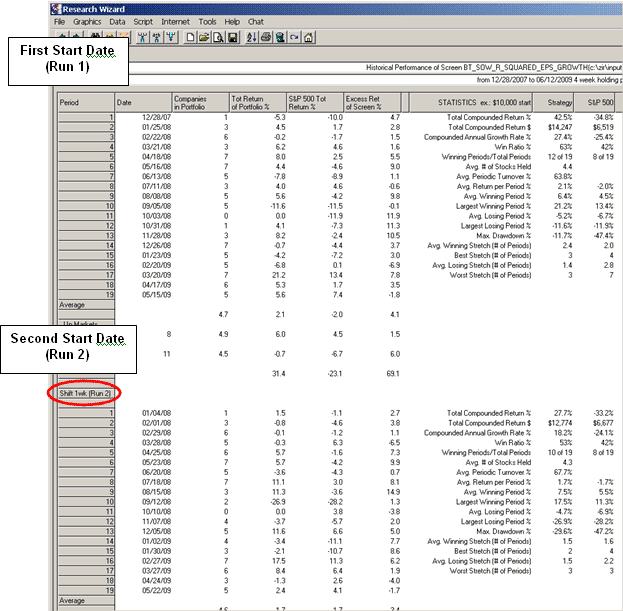
In addition to the graphical displays of performance, a statistics table appears for each start date. For example: the first start date will be at the top of the report as a default.
The second start date, i.e., Shift 1 wk (Run 2) will be below. The third start date, Shift 2 wk (Run 3), and the fourth start date, Shift 3 wk (Run 4), and etc. will be listed below as well.
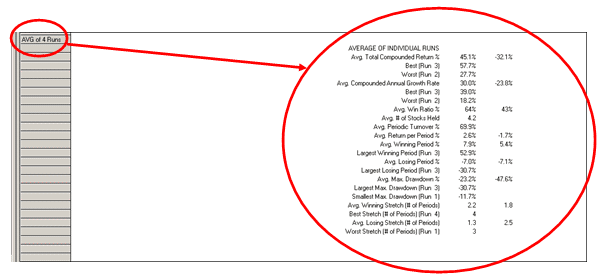
The Summary Table at the bottom (AVG of 4 Runs) (or 12 if you selected 12 Runs), shows the average performance of your strategy and the best and worst statistics along with their attributed run. (See below.)
For a review on how to read the backtest reports, please refer to Tips and Tricks 18, Understanding Your Backtest Reports.
zacksrw.com/tipsandtrick-num011.html
Downloading the Advanced Backtester
As we stated at the beginning, please check your Research Wizard to see if your subscription enables you for the Advanced Backtester. And if so, make sure you've installed it.
An easy way to check if you've downloaded the Advanced Backtester is to go to Tools on your Menu Bar and see if the Advanced Backtesting – Local Mode is available.

If you don't see that option, then you have not yet downloaded it.
-
Go to: www.zacksrw.com
-
Click on the Download Software tab
-
Click on Download/Update Advanced Backtesting and Screening Add-On
-
Enter your Username and Password
-
Click on the Submit button
It will take you to a login page.
-
Next, enter in your Username and Password and acknowledge the Terms and Conditions.
It will then take you to the DBCMHIST Backtesting Database Download page.
Select one of the DBCMHIST databases to download.
(For 'trial' users, you should download the first one or the second one.)
(Follow the instructions on that page to complete the download.)
Note: There's two parts to downloading this. Downloading the file and 'Unpacking' it.
Once downloaded, you can then switch to the Advanced Backtesting mode by going to Tools on your Menu Bar and selecting Advanced Backtesting – Local Mode.

If this option is still not available, please e-mail us at rwaddon@zacks.com
Summary
The Advanced Backtesting and Screening Add-On lets you take your backtesting studies to another level.
As you know, backtesting is one of the only ways to see how successful your trading strategies are before you place a trade.
By giving you additional ways to slice and dice your strategies, not to mention make your testing easier than ever before to do, this can help build the confidence that your strategies are robust enough to perform no matter what.
The Advanced Backtesting features are:
-
Robustness Analysis Checker (Best Case/Worst Case Analysis)
-
Combo Strategy (multi-strategy) Testing
-
Can Test for Optimum Valuations
-
Can Backtest over Extended Time Periods (goes back to 2000)
-
Backtesting Using the Consensus Factor
Take the time to learn about these features today.
Your portfolio will thank you.
Free Daily Picks from Zacks' Best Strategies
Plus, Formulas for Finding Them on Your Own
Try our Research Wizard stock-selection program for 2 weeks to access live picks from our proven strategies, modify existing screens, or test and create your own at the touch of a button. Absolutely free and no credit card needed.